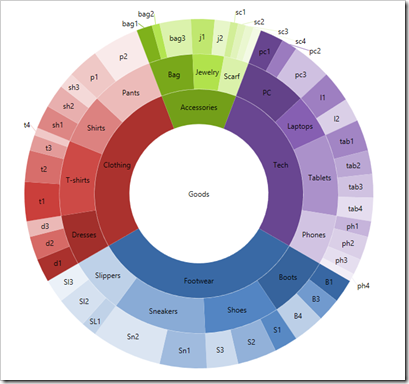
Doughnuts! (Well, Infragistics XAML Doughnut Charts anyway)
Marina Stoyanova's Blog - How to build XAML Doughnut Chart
The Infragistics packages for WPF and Silverlight contain a lot of diverse charts for data visualization. The control that we are going to look at is The Doughnut Chart. This chart supports one or more rings surrounding a blank center. It can be customized by controlling the slices labels and colors or by configuring the inner radius. In this blog you can learn how to add this control to your application and how to create a custom hierarchical chart by using multiple rings.
...
..."
This is an Infragistics graph type that I've been wanting to use for a while... I just dig how compact the information density can be, without being overwhelming or ugly. That, and I just like doughnuts. :P


No comments:
Post a Comment