If I had to draw circles to visualize SQL Joins, I would… cheat and use this…
CodeProject - Visual Representation of SQL Joins
“Introduction
This is just a simple article visually explaining SQL
JOINs.Background
I'm a pretty visual person. Things seem to make more sense as a picture. I looked all over the Internet for a good graphical representation of SQL
JOINs, but I couldn't find any to my liking. Some had good diagrams but lacked completeness (they didn't have all the possible JOINs), and some were just plain terrible. So, I decided to create my own and write an article about it.Using the code
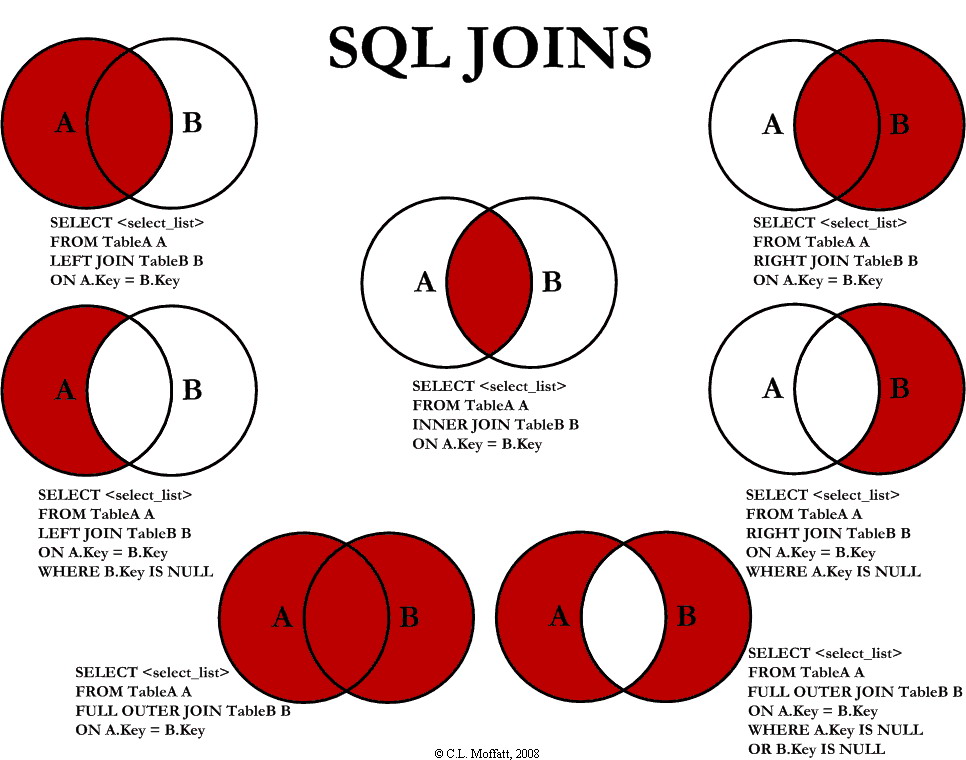
I am going to discuss seven different ways you can return data from two relational tables. I will be excluding cross Joins and self referencing Joins. The seven Joins I will discuss are shown below:
INNER JOINLEFT JOINRIGHT JOINOUTER JOINLEFT JOIN EXCLUDING INNER JOINRIGHT JOIN EXCLUDING INNER JOINOUTER JOIN EXCLUDING INNER JOINFor the sake of this article, I'll refer to 5, 6, and 7 as
LEFT EXCLUDING JOIN,RIGHT EXCLUDING JOIN, andOUTER EXCLUDING JOIN, respectively. Some may argue that 5, 6, and 7 are not really joining the two tables, but for simplicity, I will still refer to these as Joins because you use a SQL Join in each of these queries (but exclude some records with aWHEREclause).…
…”
The cheat sheet;
[Insert “a picture is worth…” quote here]


No comments:
Post a Comment