Gathering, viewing and understanding performance data with the new PerfView utility
Microsoft Downloads - PerfView
"PerfView is a performance-analysis tool that helps isolate CPU- and memory-related performance issues.
Version: 1.0
Date Published: 12/22/2011Language:English
PerfView.zip, 6.1 MB
PerfView is a performance analysis tool focusing on ETW information (ETL files) as well as CLR memory information (heap dumps). It can collect and view ETL files as well as XPERF CSV files. Powerful grouping operators allow you to understand performance profiles in ways other tools can't. PerfView is used internally at Microsoft by a number of teams and is the primary performance investigation tool on the .NET Runtime team. Features include:
- Non-invasive collection - suitable for use in live, production environments
- Xcopy deployment - copy and run
- Memory
- Support for very large heaps (gigabytes)
- Snapshot diffing
- Dump files (.dmp)
- CPU Performance
- Support for managed, native, and mixed code
- Can read XPerf logs
- Profile diffing
Supported Operating Systems: Windows 7, Windows Server 2008, Windows Server 2008 R2, Windows Vista
..."
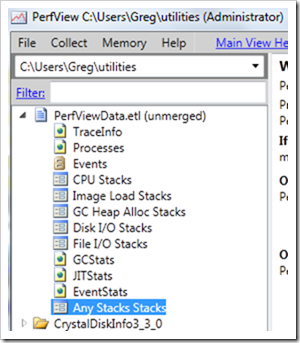
Here's a snap of the app;
And a snip from the help;
PerfView User's Guide
PerfView is a tool for quickly and easily collecting and viewing both time and memory performance data. PerfView uses the Event Tracing for Windows (ETW) feature of the operating system which can collect information machine wide a variety of useful events as described in the advanced collection section. ETW is the same powerful technology the windows performance group uses almost exclusively to track and understand the performance of windows, and the basis for their Xperf tool. PerfView can be thought of a simplified and user friendly version of that tool. In addition PerfView has ability to collect .NET GC Heap information for doing memory investigation (Even for very large GC heaps). PerfView's ability to decode .NET symbolic information as well as the GC heap make PerfView ideal for managed code investigations.
Deploying and Using PerfView
PerfView was designed to be easy to deploy and use. To deploy PerfView simply copy the PerfView.exe to the computer you wish to use it on. No additional files or installation step is needed. PerfView features are 'self-discoverable'. The initial display is a 'quick start' guide that leads you through collecting and viewing your first set of profile data. There is also a built in tutorial. Hovering the mouse over most GUI controls will give you short explanations, and hyperlinks send you to the most appropriate part of this user's guide. Finally PerfView is 'right click enabled' which means that you want to manipulate data in some way, right clicking allows you to discover what PerfView's can do for you.
What can PerfView do for you?
PerfView was designed to collect and analyze both time and memory scenarios.
- CPU Investigation: One of the more useful events (and one that is turned on by default) is the 'profile' sampling event. This event samples the instruction pointer of each of the machine's CPUs every millisecond. Each sample captures the complete call stack of the thread current executing; giving very detailed and useful information about what that thread was doing at both high and low levels of abstraction. PerfView aggregates these stack traces and presents them in a stack viewer that has powerful grouping operations that make understanding this data significantly simpler than most profilers. If your application's performance problem is associated with excessive CPU usage, then PerfView will tell you that and give you to tools you need to understand exactly what portion of your application is mis-behaved. See Starting a CPU Analysis for more
- Managed Memory Investigations: PerfView also has the ability to take a snapshot of the .NET GC heap. Because these heaps can be very large, PerfView allows control over how large of a sample is taken, and goes to some trouble to take a representative sample if the heap is too big to capture in its entirety. It then converts the graph of objects in the heap into a tree, and displays this in the same stack viewer that was used for CPU investigations. See Starting a GC Heap Analysis for more
- Blocked Time Investigations: If your program is too slow, but it is not consuming excessive CPU, then it must be blocked waiting on something else (disk network, ...). PerfView can instruct the OS to log events whenever threads sleep or wake up, and has a display for visualizing where your program is waiting. See Starting Blocked Time Analysis for more
...
And here's some snaps after running a collection (i.e. machine wide) for a few;
One of the cooler things is the help. Included is not only the usual "stuff," but also an in-depth tutorial, tips for really understanding the data and turning all the raw data into information and knowledge...


No comments:
Post a Comment