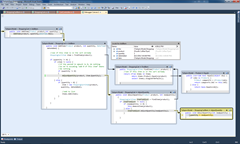
I wish there was a way debug my app visually, a diagram of what’s going on and where I am, a canvas like view of the call stack… Something like the “Debugger Canvas” from Microsoft DevLabs!
Somasegar's WebLog - Debugger Canvas on DevLabs
“Debugger Canvas is a new user experience for stepping through code in the debugger in Visual Studio Ultimate. It displays the code of each of the methods you step into on a canvas with call lines between them, helping you keep track of the bigger picture as well as the details.
Debugger Canvas pulls together all the code along a call path into a single display for browsing and even editing. Instead of having to keep all the code in your head while you look at one file tab at a time, now you can see the entire path on the canvas, enabling you to more easily track the flow of control and data through your application. Below, you can see an example where we have stepped into the execution of the Add Item function of a website shopping cart. The functionality requires the coordination of several methods, and the canvas lets you see them side by side so that you can more easily find and fix bugs.
…
Debugger Canvas also highlights the potential of several of the technologies we introduced in Visual Studio 2010 Pro and Ultimate. It takes advantage of the flexibility of the new code editor to show fragments of files as bubbles on the canvas with a fully functioning editor in each. We built Debugger Canvas on top of Visual Studio Ultimate so that we could also use the underlying technology for the Dependency Diagrams to identify and display the right fragments on the canvas. This let us support both C# and VB in this release and will help us support other languages in the future. Building on VS Ultimate also allowed us to provide a new user experience for IntelliTrace, enabling some interesting scenarios, such as “show me what code ran when I clicked here”.
…”
Debugger Canvas is the result of a collaboration between Brown University and Microsoft, integrating ideas from Brown University’s Code Bubbles project into Visual Studio.
This is what you can do in this version of Debugger Canvas:
- Step into methods on a canvas using the debugger
- Use the normal debugger features in the canvas
- Share a canvas as an XPS image
- Take snapshots of local variables so you can make comparisons as you step through code multiple times
- Add related methods to the canvas using Go to Definition and Find All References
It also has some more features that are under development and which you can turn on if you’d like to try them:
- Edit code directly on the canvas (including edit and continue if available) by enabling the option in the options dialog
- Visualize IntelliTrace logs as fragments on the canvas, or step through IntelliTrace logs using the canvas
Our goal with this power tool is to try out these use interface features to see how they work in real life development situations. And depending on your feedback, some of this may very well make it into a future version of Visual Studio!
Debugger Canvas - Debugger Canvas Guide
Supported languages and item types
- Debugger Canvas supports C# and Visual Basic.
- It supports only code files, not XML files or designers etc.
Getting started
- Getting started is easy. First, download the VSIX.
- Install VSIX by double clicking on it.
- Open a C# or Visual Basic project.
- Set a breakpoint.
- Start debugging as normal. When you hit the breakpoint, the Debugger Canvas will appear with the method in which you've hit the breakpoint.
- Use debugger as you normally would, stepping in and out of methods, inspecting values, etc. You'll see that each method is put on the canvas.
What happens to the Canvas?
- The canvas stays around until you close it or close Visual Studio.
- If it is still open, it will be reused next time you run the debugger.
- You can create a new canvas under the Debug:Debugger Canvas menu.
- If you have multiple canvases, the active one will be used for next debug session.
- When you close Visual Studio, the canvas goes away. Unfortunately it cannot be saved, but see below for a way to save it as an image.
Using Debugger Canvas as little or as much as you want
…
Shiny! Install for me was a snap (GOT to love VS 2010’s extensibility/VISX’s). Going to take a little bit to get used to using it. I’m so used to the old VS debugging mode that using something like this is “different.” Still in playing with it for only a few minutes I can see where this will come in handy. It’s the seeing of all the code files in the call stack, without having to flip tabs, etc, where I can see using this. It gives you a higher level view for debugging without hiding the code.
And that aside, this might help justify really big monitors for dev’s… (my notebook screen, even zoomed out, isn’t really cutting it… lol)
NOTE: This is currently for VS 2010 Ultimate only…


No comments:
Post a Comment